

Using Python and Google Cloud Vision to Automate my Algebra Homework — Cloud Vision API Tutorial


Recently, I used the Google Cloud Vision API to create a Python script that takes an image of my linear functions algebra homework and plots the graph of the linear equation for each question. In this tutorial, I will be showing you how I did this and how you can too. We will be learning about what the Cloud Vision API is and how to use it with Python.
What is the Cloud Vision API?
Cloud Vision is a Google Cloud API. Basically, Google Cloud APIs allow us to interact with GCP services. (Note: If you do not know what an API is, check out my post explaining APIs in detail.)
Google Cloud APIs are programmatic interfaces to Google Cloud Platform services. They are a key part of Google Cloud Platform, allowing you to easily add the power of everything from computing to networking to storage to machine-learning-based data analysis to your applications.
Google Cloud offers a range of machine learning APIs, including the Speech-to-Text API, the Cloud Translation API, the Cloud Natural Language API and the Cloud Vision API. With these machine learning APIs, we can access Google’s pre-trained machine learning models with an API request (this could be done using REST or Google’s client libraries — more on this later).
So, instead of training a machine learning model ourselves, we can use a Google Cloud API.
The Cloud Vision API enables us to understand the contents of an image. This is known as computer vision. Computer vision is a field of Artificial Intelligence concerning how computers can develop an understanding of images and derive insights from them.
With Cloud Vision, you can detect objects in images, detect faces in images, extract text, identify logos or identify landmarks. Detecting text from images is known as OCR (Optical Character Regulation).
In our case, we’re creating a Python script that plots a graph for the linear equations from a worksheet. We can use the OCR feature of Cloud Vision and identify the text inside the worksheet. We could then later extract the equations from it in order to plot them.
Setting up the Cloud Vision API
- Log-in to Google Cloud Console and create a new project.
- Make sure that billing is enabled for the project. Pricing will not be discussed in this tutorial, however, the first 1000 API requests will be free.
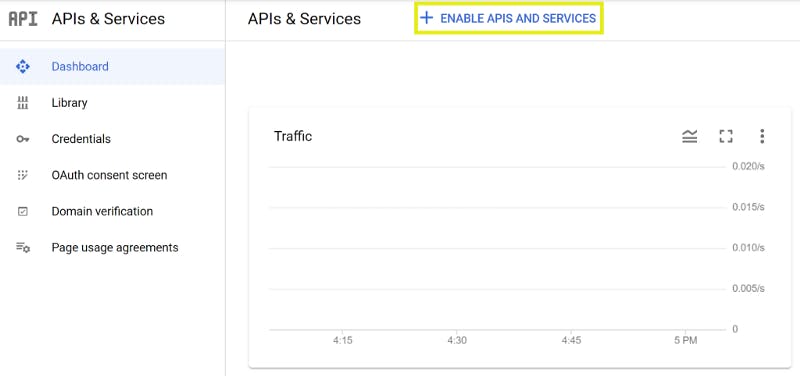
Head over to the APIs & Services dashboard. From there, click on “ENABLE APIS AND SERVICES”.
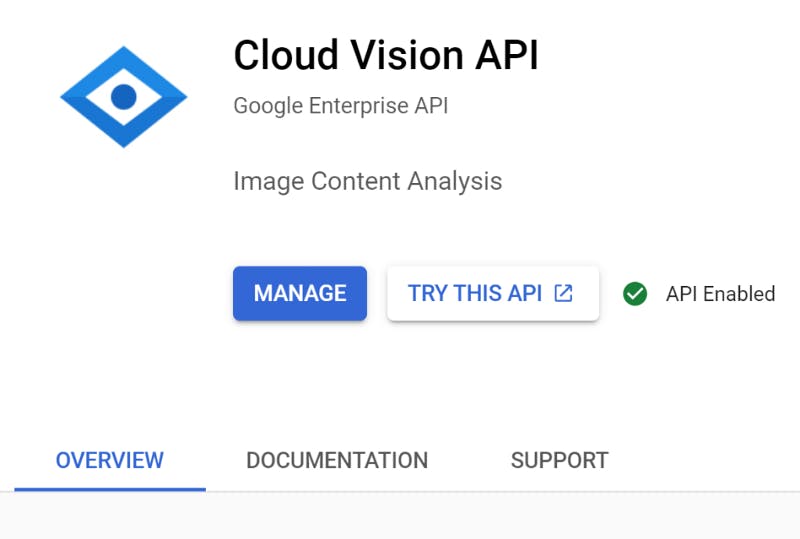
From the API library, search for the Vision API and choose Cloud Vision API. Enable the API.
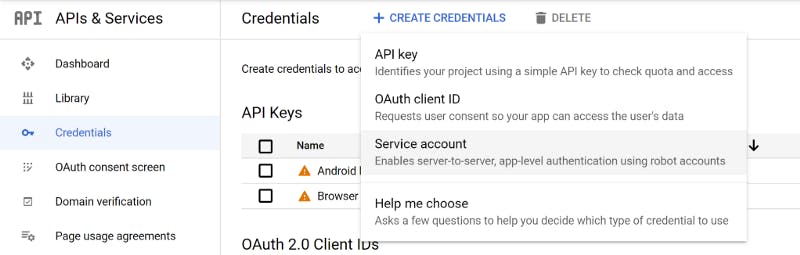
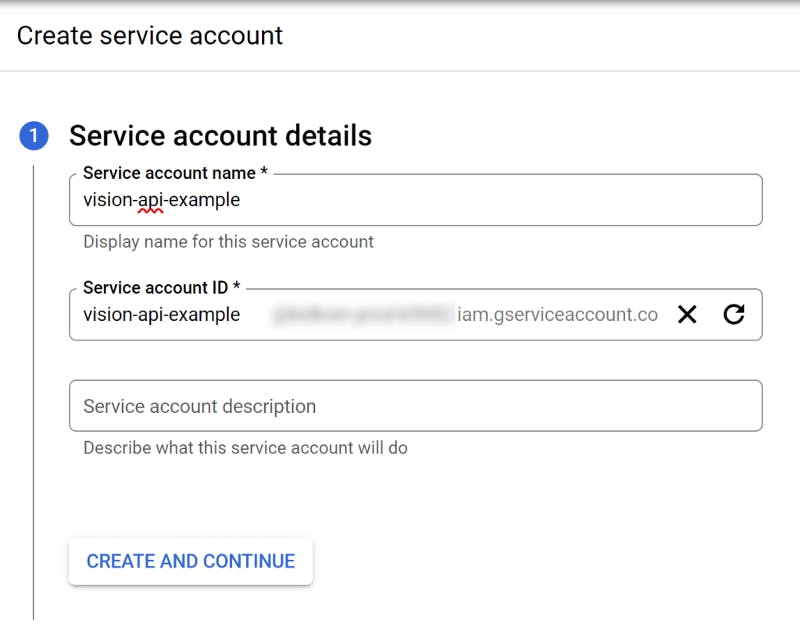
Now, you must create a service account. A service account authorizes an application to use GCP services on your behalf. This is useful for us when we want to authorize our Python script to call the Cloud Vision API. We can create a service account and download the secret key which will tell Google that we are making an authorized API request.
Name the service account what ever you like. I’m just going to leave the Service account ID as default.
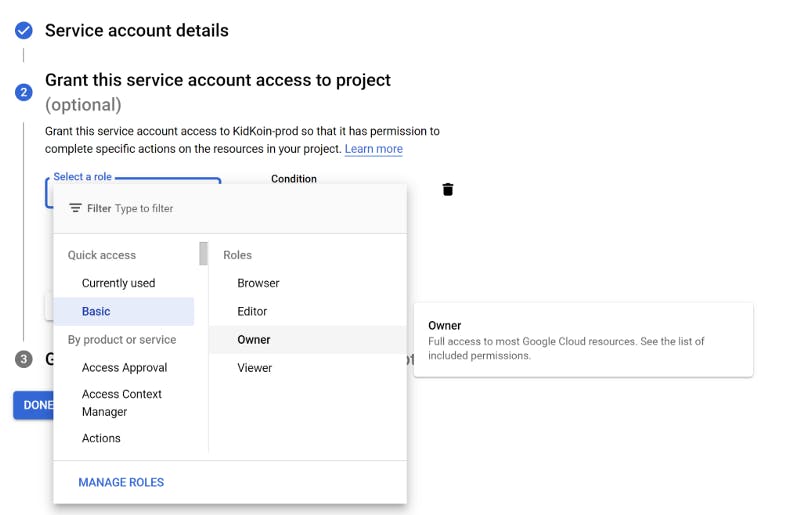
Now we need to allow this service account to be able to access services. For the sake of this tutorial, I’m just going to grant this service account Owner access. This will provide full access to most Google Cloud resources to this service account. Then click done.

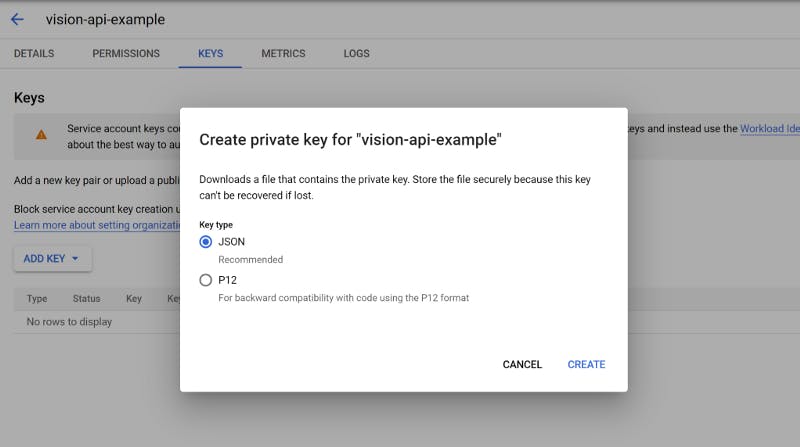
Select the keys tab, click on “ADD KEY”, and choose “Create new key”. Select the JSON key type and click “Create”. This will download the private key as a JSON file. We will later be able to use this private key to help Google Cloud authorize our Python script to use the Cloud Vision API.
Using the Cloud Vision API
So now that we have set up the Cloud Vision API, we’re ready to start coding.
The Cloud Vision API can be accessed by making HTTP requests. However, we can also use Google’s client libraries from our code. This way, we don’t have to manage the low-level details of connecting with the server and making the HTTP request. Google’s client libraries are available in quite a few programming languages including Python.
To install the client library, run the following command from your terminal or command line.
pip install --upgrade google-cloud-vision
Then, let’s import the libraries and modules we will require:
from google.cloud import vision

import io
import os

import re

import matplotlib.pyplot as plt
import numpy as np

import matplotlib.ticker as ticker
Now, move the service account JSON key into the same folder as your Python script and rename the key file to: keyFile.json.
We also need to set the environment variable GOOGLE_APPLICATION_CREDENTIALS and assign the path of the key file to it. The Google client library will automatically look for this environment variable and use the JSON key file to authorize our API request.
os.environ['GOOGLE_APPLICATION_CREDENTIALS'] = 'keyFile.json'
Save a picture of whatever you would like to detect text from. In this case, I’ve downloaded a photo that I took of the linear equations worksheet and moved it to the same folder as my Python script.
Provide the path to the file that you are using and then read the contents of the image file.
with io.open('worksheet.jpeg', 'rb') as image_file:
    content = image_file.read()
Next, let’s create an instance of the ImageAnnotatorClient and create a client Image object using the contents of the image file we’ve just read above. The Cloud Vision API will be able to take this Image object and return a response. After establishing a connection with the API, we’ll store the response as well.
vision_client = vision.ImageAnnotatorClient()
image = vision.Image(content=content)

response = vision_client.text_detection(image=image)
We can read the detected text from the response like this:
text = response.text_annotations[0]
full_text = text.description
If we print the full_text variable, we should see all the text from the image that we used.
Extracting the Equations using Regular Expressions
Unfortunately, the text we have isn’t very helpful for us right now. It’s just all the text from the worksheet, but we only want the equations. To do this, we can use Regular Expressions (commonly referred to as RegEx). Regular Expressions are special sequences of characters that identify patterns in a string. These are commonly used to validate text or search for a specific pattern in a string. We can use RegEx to find all the equations in the string that we get back from the Cloud Vision API.
We need to emove the spaces from the full_text string using the replace method. This will make it easier to find patterns using RegEx. We will also use re.finditer() which will return an iterator over all the non-overlapping matches in the full_text string. For this tutorial, we will not discuss the Regular Expression in detail. Just know that we are finding all the matches of a linear equation in the string containing the text from the image that we are providing to the Cloud Vision API. We are storing the matches in a list called questions.
full_text = full_text.replace(' ', '')
questions = [x.group() for x in re.finditer(r'[y]=(\(*[0-9]*\/*[0-9]*\)*)*[x]([\+|\-][0-9]*)*', full_text)]
Graphing the Linear Equations
Now that we have a list of all the linear equations from the worksheet, we’re going to be using NumPy and Matplotlib to create the graphs. NumPy is a famous Python library used for working with multi-dimensional arrays and Matplotlib is a Python library used for visualizing data.
We’ll be using NumPy to create an array of values for x and y which we will be able to plot with Matplotlib.
If you haven’t already, install the Matplotlib and NumPy libraries with the following commands:
pip install numpy
pip install matplotlib
The module, matplotlib.pyplot, provides an interface for us to use to plot graphs and visualize data.
However, before we can plot the graphs for the linear equations, we have to find the gradient and y-intercept in each of the equations. Let’s define a function that does this.
The function takes an equation as input and returns the gradient and y-intercept. We’re again using RegEx. Essentially, we’re finding a match in the string for the gradient and y-intercept groups which are defined in the Regular Expression. If the gradient and y-intercept are not equal to None, we convert them to an integer type. Otherwise, we assign a value of 1 to the gradient or 0 to the y-intercept.
def extract_gradient_and_y_intercept(equation):
    equation = equation.replace(' ', '') # remove all spaces

    gradient = re.search(r'(?P<y>[y])=(?P<g>(\(*[0-9]*\/*[0-9]*\)*)*)[x](?P<yi>[\+|\-][0-9]*)*', equation).group('g')

    if gradient != None:
        gradient = int(gradient) # convert the gradient to an integer
    else:
        gradient = 1

    y_int = re.search(r'(?P<y>[y])=(?P<g>(\(*[0-9]*\/*[0-9]*\)*)*)[x](?P<yi>[\+|\-][0-9]*)*', equation).group('yi')

    if y_int != None:
        y_int = int(y_int)
    else:
        y_int = 0

    return gradient, y_int # return the gradient and y-intercept
Finally, we’re ready to plot the graphs for the linear equations!
The independent variable in our linear equations is called x, and y is the dependent variable. Consequently, the value of y changes according to the value of x. So, to plot the linear functions, we create a NumPy array of a range of numbers and assign it to a variable called x. We then multiply the x array by the gradient, add on the y-intercept and assign the new NumPy array to the y variable.
for linear_equation in questions:
    gradient, y_int = extract_gradient_and_y_intercept(linear_equation)

    x = np.array(range(-5, 5))
    y = x * gradient + y_int
Now we can plot these two NumPy arrays using Matplotlib:
question_number = 0
for linear_equation in questions:
question_number += 1
gradient, y_int = extract_gradient_and_y_intercept(linear_equation)
# Create the vectors X and Y
x = np.array(range(-5, 5))
y = x * gradient + y_int
fig = plt.figure() # create a new figure
ax = fig.add_subplot(1, 1, 1) # add a subplot
plt.grid(alpha=.4, linestyle='--') # add a grid on the graph
plt.axis('equal') # scales the axes equally
plt.title('Question {}'.format(question_number)) # add a title
ax.xaxis.set_major_locator(ticker.MaxNLocator(integer=True)) # set the ticks on the X-axis all as integers
ax.yaxis.set_major_locator(ticker.MaxNLocator(integer=True)) # set the ticks on the Y-axis all as integers
ax.spines['top'].set_color('none') # make the top spine invisible
ax.spines['bottom'].set_position('zero') # set the bottom spine to meet at zero
ax.spines['left'].set_position('zero') # set the left spine to meet at zero
ax.spines['right'].set_color('none') # make the right spine invisible
plt.plot(x, y) # plot the graph
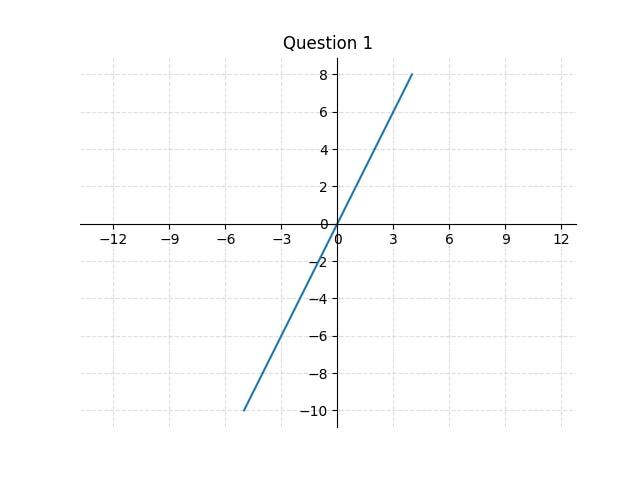
plt.show() # display the graph
The result should look something like this:
Conclusion
Hopefully, you were able to follow along and enjoyed this tutorial. Google Cloud Vision is awesome and there’s tons of cool stuff you can build with it and other Google Cloud machine learning APIs.